Easy Charts: Streamline Data Visualization with Effortless AI Chart Creation
Easy Charts is a powerful yet user-friendly AI tool that empowers individuals and teams to create and customize professional data visualizations without the need for subscriptions or downloads. This intuitive platform allows for unlimited chart generation and offers versatile export options in JPG, PNG, and SVG formats, making it an ideal alternative to complex spreadsheet software.
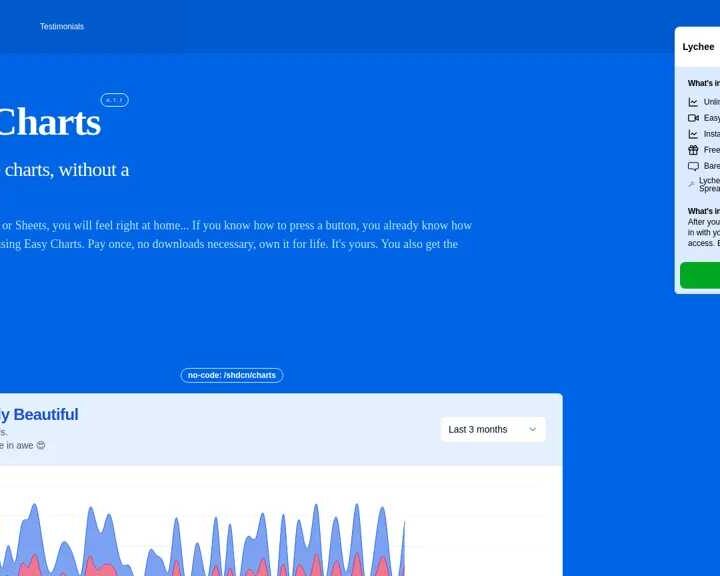
For users familiar with spreadsheet applications like Excel or Google Sheets, Easy Charts significantly simplifies the process of crafting visually appealing charts, drastically reducing the time and effort required for effective data visualization. Its intuitive interface and comprehensive customization options allow users to quickly generate polished charts for diverse purposes, enhancing data clarity and impact.
Key Features and Benefits:
- Unlimited Chart Generation: Create an unlimited number of charts for various data sets and needs, perfect for ongoing analysis.
- Versatile Export Options: Export charts in high-quality JPG, PNG, and SVG formats, enabling seamless integration into presentations, reports, and digital content.
- Intuitive Customization: Tailor charts with a wide range of options to enhance visual appeal and ensure data clarity for any audience.
- Effortless Accessibility: Utilize this cloud-based chart maker without any software downloads, enabling instant access and convenient online use from any device.
- AI-Powered Assistance: Leverage artificial intelligence to simplify chart creation and data interpretation.
Use Cases and Applications:
- Business Presentations: Effortlessly create compelling and professional presentations for business meetings, leveraging Easy Charts’ intuitive interface and comprehensive customization options for a polished visual experience.
- Academic Research: Generate informative charts for research papers with ease, eliminating the need for advanced technical skills. Seamlessly export charts in various formats to comply with publishing requirements.
- Marketing Campaigns: Empower marketing teams to create engaging reports and infographics, transforming raw data into visually appealing and impactful visuals for marketing campaigns and performance tracking.
- Data Analysis: Quickly visualize complex datasets to identify trends and insights, making it easier to understand and communicate findings.
Target User Groups:
- Data Analysts
- Product Managers
- Financial Analysts
- Marketers
- Researchers
- Students
Pricing:
Easy Charts offers a cost-effective one-time payment plan for $39.99, providing users with lifetime access to its powerful features and capabilities.
Easy Charts Ratings:
- Accuracy and Reliability: 3.6/5
- Ease of Use: 3.9/5
- Functionality and Features: 4/5
- Performance and Speed: 3.6/5
- Customization and Flexibility: 4.3/5
- Data Privacy and Security: 4.1/5
- Support and Resources: 4.1/5
- Cost-Efficiency: 4.3/5
- Integration Capabilities: 4.2/5
- Overall Score: 4.01/5